View Statistics for Crowdfunding
Once campaigns and fundraiser pages are complete, a charity can study an overview of all the crowdfunding features using different statistics. Login to the Umbraco staging backoffice using your login credentials and click Crowdfunding. By default, the page is set to production.
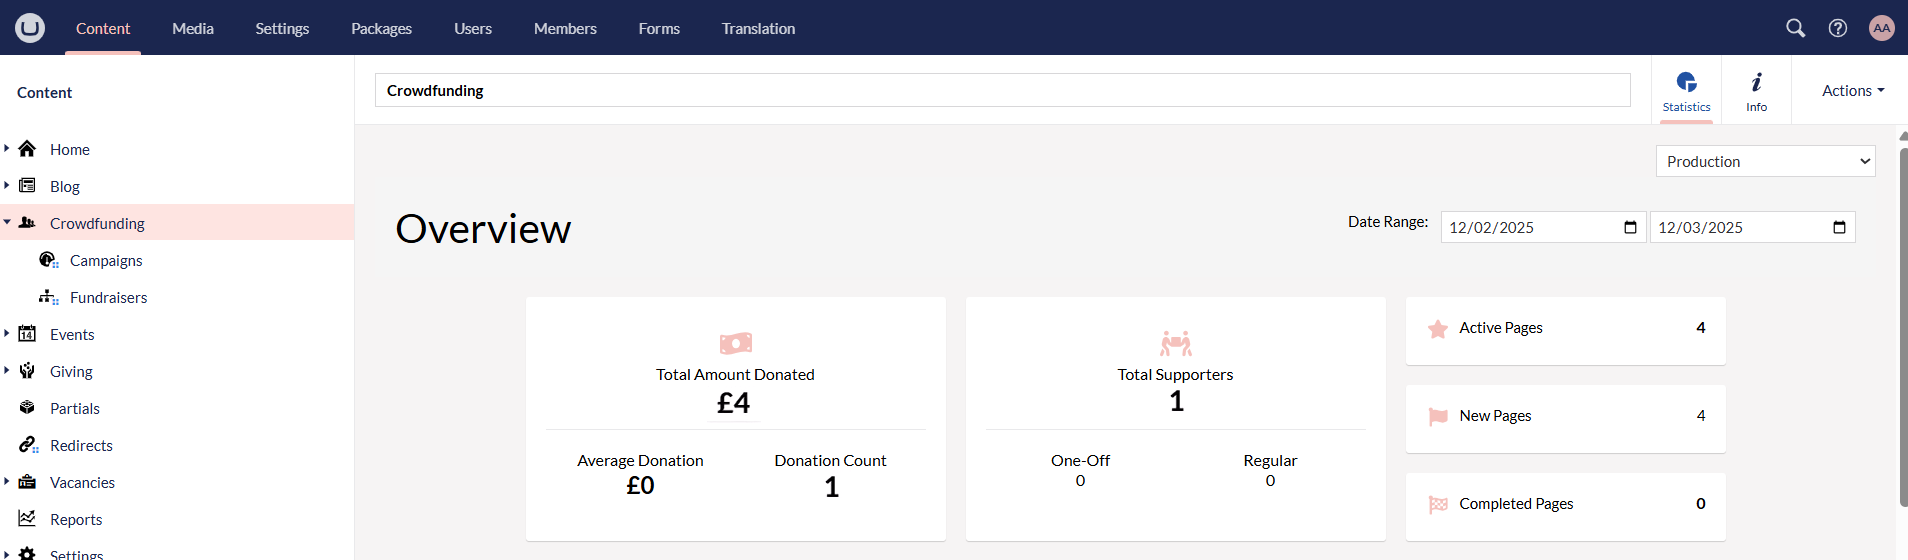
Let us have a look at the different statistics the crowdfunding page displays.
A date range featuring a set time period can be chosen and each stat will be shown accordingly.
The first box shows total amount donated via crowdfunding campaigns, average and total donation.
The second box tells about the total number of donors/supporters that contributed towards the campaign and fundraiser pages and the number of type of donations (single/one-off and regular).
Next to the second box, you can see total number of active, new and fully complete fundraiser pages.
Below the first and second boxes, a graph displays the donation/income according to the date it was made on.
Beside the graph, a table describes:
- The number of top active campaigns and the percentage of total number of donations raised from them.
- The number of top active fundraiser pages and the percentage of total number of donations raised from them.
Below the graph, you can see a horizontal bar chart showing the top allocations that give a maximum count for different donations and a pie chart explaining the number of fundraiser pages created for multiple campaigns.
